Author Archives: Ket Garden

Hi Tech Earnings

VIX have plummeted, and are now trading at 13,04. It simply tells us that there is no fear out there. Indices are setting new ATH, but Dow seems to be a little bit calm. Asian markets are up today. Nikkei rose to a three-week high and added 0,9% to 14,693,57. The highest since Sept. 27. The Topix advanced 0,6% to 1,212,36.

Google is for the fist time above 1000 dollars. Shares gained 13,8% and ended the trading session at $1011,41. Google`s earnings rised the S&P technology sector to outperform all other sectors. It rose 1,8%. Now it is time for Netflix and Apple. I look forward to see their earnings. This is money machines and they should beat the numbers, and that will make the momentum to continue this week.

U.S debt is now $17.075 trillion. That`s a lot of money, but I`m glad we can focus on the earnings now and not the debt. 62,2% of the 98 companies that have reportet earnings so far on S&P 500 have topped Wall Street`s earnings expectations. I look forward to the earnings this week.

5,57 billion shares was traded on friday and that is slightly above the average. Gold is back above the support level at $1300. If gold is not the safe heaven, VIX should be the new one. Right now VIX is closed at 13,04. News today: Existing Home Sales at 10:00am.

Apple

Disclaimer: The views expressed in this article are those of the author and may not reflect those of Shiny bull. The author has made every effort to ensure accuracy of information provided; however, neither Shiny bull nor the author can guarantee such accuracy. This article is strictly for informational purposes only. It is not a solicitation to make any exchange in precious metal products, commodities, securities or other financial instruments. Shiny bull and the author of this article do not accept culpability for losses and/ or damages arising from the use of this publication.

Leave a comment

Filed under Stock market

Google up 8,18%

Wow! Google is up 8,18% on after-hours trading to $961,48 on Q3 earnings. What a marketing company!!! Yesterday, the Google`s CEO Larry Page, CFO Patrick Pichette and Chief business officer Nikesh Arora were on the conference call to report it`s Q3 earnings. Take a look at the chart below. You know what stock you should buy in 2005?

Google

Google`s gross revenue is up 12% to $14,98. Google are still growing, and their net income was $2,97 billion ($2,18 billion in Q3 last year). In 2012, their EPS (earnings per share) was $8,87, but now it is $10,74. Google beats the analysts expectations. The stock is trading at $961,48 in after-hours trading. Wow!

Belive it or not, but the big business is comming from paid clicks, which is clicks related to ads served on Googles site. At the same time the cost per click goes down. More and more people are clicking on the ads that Google serves.

Google income

Google, Facebook and Yahoo`s big challenge now is the consumers shift from PC to mobile phones/smartphones and tablets were the advertising rates are lower. The price marketers pay Google decreased by 8%, but the total amount of paid click rose 26% and that is the highest rate of growth on one year.

Yahoo by the way, are reporting an decrease in the revenue in Q3, and are lowering it`s financial outlook. Motorola lost $248 million in Q3. But what stock should you buy 12 months ago? It`s Yahoo. That stock is up about 100% in 12 months. That`s pretty good!

Leave a comment

Filed under Stock market, Stocks

Bullish Bullish Bullish

It`s optimism in Asia, and all the indices are up. All this of course because of the good news we all got from the Capitol Hill yesterday. They came to an agreement only two hours before the deadline, and now the can rise the limit and borrow more money.

The shutdown is also over and one million people can get back to work again. The agreement is only for a short periode of time. Desember 13 is the next date for a new agreement. That is for an agreement in a long run.

Stocks went up in the US after the good news and gold is up too. VIX is down 21,17%. Many hedgefunds have lost a lot of money yesterday. Right now gold is trading at $1306,10. So, what am I suppose to do now, you said? Well, as I have told you before, in the US, the P/E (price/earnings) is 20, which means Europe is a better bet, because P/E in Europe is 10.

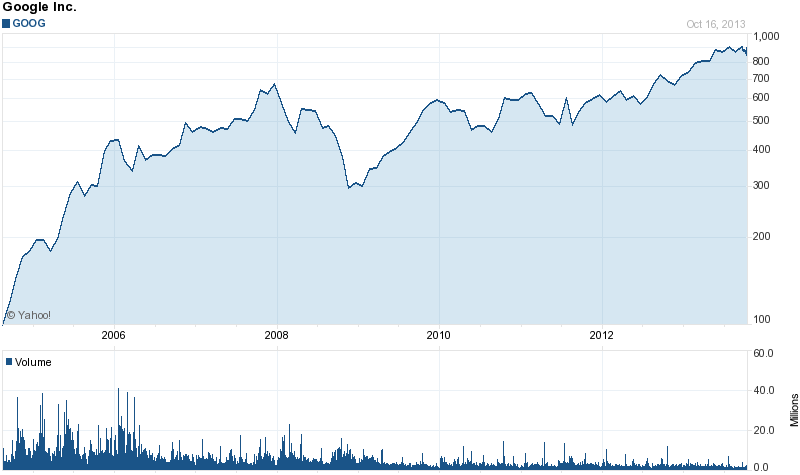
Where do you find the bullish stocks, and when are you getting in, and when are you getting out. Many have asked me about that, and this is the point where many are struggling. Let`s look at the chart for Microsoft and Apple.

Msft and Aapl

If you bought those two stocks in the 80`s, you would have a huge gain today. But who is sitting on their stocks for 30 years? If you bought Microsoft in 2000, you would have lost your money today. If you bought Apple 10 years ago you would have a huge gain today. When to go in and out of a stock is sometimes difficult.

Many investors tend to remember the losing trades much better than the winning trades. It`s all about feelings when it comes to invest money. If you lose money you can get so nervous that it will be impossible to make good decisions again. The mere thought of losing money blocks the opportunity you have in the market.

Controlling emotions is very important when you are investing money in the market, because emotions can play havoc with your investing. That`s why you need to have a plan that makes you prepared no matter what happens in the market.

Emotional investors usually do wrong decisions and there is many of them. If you are one of them, it doesn`t mean you can be a successful investor. It simply means you have to acknowledge your concerns.

First of all you need a plan. Before you buy stocks you need to have a selling plan. You have to decide at what point you want to sell the stock. Stocks goes up and down, and you need to consider how low you think the stock might fall. Professional investors do always set a “stop loss”.

How much money can you affort to lose? 10%? 20? More? You must find your exit strategy. With a plan in your hand you can take away your emotions, and better understand when to avoid holding the stock too long or when to selling the stock to early.

You do not want to lose money. Nobody does that. If you want to buy and hold, and sit on the stock for a long time, you don`t want to exit out prematurely, but you do not want to see a great gain disappear either if a stock begins a sustained downward plunge.

The pros often use trailing stops and stop loss orders. These strategy will help you to protect your investments against losses. These strategies will not give you a guarantee to profit or protect you against an absolute losses, but it will help you to control your emotions to make betters decisions, which means better investments over time, so stick to your plan.

A Price to book ratio (P/B ratio) is used to compare a stock`s market value to its book value. It is calculated by dividing the current slosing price of the stock by the latest quarter`s book value per share, also known as the «price-equity ratio».

A stock is undervalued if the P/B is very low. But it can also be a warning that it is something wrong with the company. This ratio also gives you an idea of whether you`re paying too much for what would be left if the company is bankrupt tomorrow.

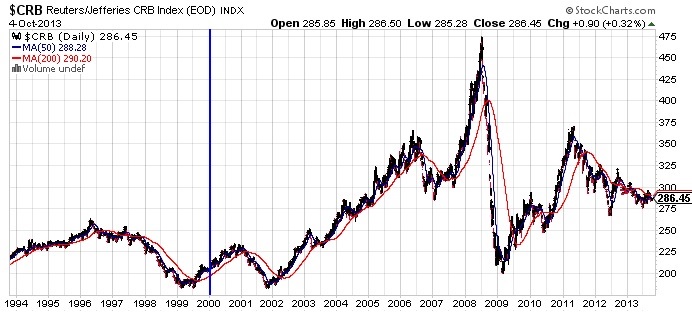
If you look at all the companies and shares in S&P 500, you will also find a P/B for that index. A very useful technique that tells you how cheap or expensive the stocks are right now. Take a look at the chart I have added today. This chart will give you a picture of the situation a the moment.

PB value

Current S&P 500 Price to Book Value: 2,53 +0,03 (1,38%)

Wed Oct 16

Mean: 2.75
Median: 2.73
Min: 1.78 (Mar 2009)
Max: 5.06 (Mar 2000)

Current price to book ratio is estimated based on current market price and S&P 500 book value as of June 2013 — the latest reported by S&P.

News for today: Unemployment Claims at 8:30am, Philly Fed Manufacturing Index at 10:00am.

Disclaimer: The views expressed in this article are those of the author and may not reflect those of Shiny bull. The author has made every effort to ensure accuracy of information provided; however, neither Shiny bull nor the author can guarantee such accuracy. This article is strictly for informational purposes only. It is not a solicitation to make any exchange in precious metal products, commodities, securities or other financial instruments. Shiny bull and the author of this article do not accept culpability for losses and/ or damages arising from the use of this publication.

Leave a comment

Filed under Stock market, Stocks

Capitol Hill Thriller

Very often I start the day by looking at the exchanges in Asia. It gives me a picture of what mood people are in at the moment. October 17 is tomorrow and the congress do still not have an agreement about the debt limit and Obamacare. People wait and see what`s happening.

The stockexchange in Asia is mixed today. MSCI Asia Pacific didn`t move today. Nikkei 225 is up 0,1%, Topix is falling 0,08%, CSI in China is down 1,42% and Shanghai Composites are falling 1,35%.

Hang Seng are falling 0,4%, Kospi are down 0,03%, Straits Times are up 0,39%, Taiex falls 0,2% and S&P/ASX200 is up 0,14%. As you can see, there is not any big moves in Asia. What moves the markets right now is the White house and Capitol hill.

A default means higher borrowing costs for the U.S and that means a slowdown of the global economy. It`s very difficult to understand why the U.S want more expensive money? A default would be a disastrous.

People at the World Bank and I.M.F said they belived the impasse would be resolved before october 17. If so they have to hurry up. The risk is that the government do not have enough money to pay its bills, and that`s for the first time in history. They are playing a game in Capitol Hill, and for all I know, they will probably come to an agreement in the last hour. It`s a political problem.

Is this the reason that is going to break the bullish trend? If not, we have to look for the unexpected. As long as we have this financial system, there must always builds up an bubble. So, what is the next bubble?

44% of the stocks on S&P 500 are high divident yield stocks. It`s the highest since 1970, and a little bit above it`s 35% average. This is crazy. And this is so called «safe stocks»? We are at the all time high, so it`s time to be careful.

News to look at today: Crude Oil Inventories at 10:30am, Beige Book at 2:00pm.

Capitol hill

Disclaimer: The views expressed in this article are those of the author and may not reflect those of Shiny bull. The author has made every effort to ensure accuracy of information provided; however, neither Shiny bull nor the author can guarantee such accuracy. This article is strictly for informational purposes only. It is not a solicitation to make any exchange in precious metal products, commodities, securities or other financial instruments. Shiny bull and the author of this article do not accept culpability for losses and/ or damages arising from the use of this publication.

Leave a comment

Filed under Stock market

The supercycle is over?

The gold is historically a hedge against the market. It`s a safe heaven. In volatile markets, we often see increasing gold prices. So, why is it so calm out there now?

Commodities use to move in a very long cycles that last many years. That`s what we call a super cycle. In the historically chart below we can see the cycle goes on between 20 and 30 years. The last cycle was a declining cycle that started in 1980 and ended in the year 2000.

As you can see from the CRB chart I have added today, the new super cycle started in 2000. The commodity prices increased in eight years, and plummeted in 2008 during the financial crises. Reuters/CRB index is an index with 28 commodities, which is commodity prices ranging from metals to oil and grains. 26 of the commodities are listed on the US and Canada exchanges.

As you can see in the chart below, we are now in the middle of the bottom in 2000 and the top in 2008. Where do we go from here? Are the commodities bullish trend over? Or is it starting a new trend? A bullish trend?
CRB

First of all; the bullish trend started in 2000 because the demand increased. At the same time the supply was at a minimum because of the downtrend we have seen since 1980. Many of the miners had to shut down their businesses. Rising demand and minimum supply means increasing commodity prices.

Most of the demand came from emerging markets. The GDP in China rose 12% a year. The supply startet to increase again which had an impact of the commodities prices. The first phase seems to be over. Do we have a phase nr two comming up soon?

If so, China will be the trigger to the next cycle by consumer spending as they spend Yuan like never before. The Chinese people are earning more money now than ten years ago. In 2004 the average income was 8500 Yuan per year. That`$1400 dollars. Today they earn about 25000 Yuan or $4200 per year.

No one is paying attention on the ernings this week. Everyone`s eyes is on Capitol Hill and the White house now. I look forward to see the earnings of Google and Apple. News to for today: Empire State Manufacturing Index at 8:30am.

Disclaimer: The views expressed in this article are those of the author and may not reflect those of Shiny bull. The author has made every effort to ensure accuracy of information provided; however, neither Shiny bull nor the author can guarantee such accuracy. This article is strictly for informational purposes only. It is not a solicitation to make any exchange in precious metal products, commodities, securities or other financial instruments. Shiny bull and the author of this article do not accept culpability for losses and/ or damages arising from the use of this publication.

Leave a comment

Filed under Commodities