Tag Archives: Dow Jones

If this a an average bear market we will se it bounce very soon

It has been a brutal stock sell off in December and so far in 2019, and MSM is telling you that we are officially in a bear market. It seems like the market is pricing in a recession, but it can be too early to say so.

The 10-year Treasury remain below 3 percent and the FED shouldn`t raise rates for the 10th time in 2019. If they push the hold button, I think the market will be happy and bullish again. Just look at the healthy job market and the strength of the U.S economy.

December 2018 was the worst December for the Dow since 1931, but if we avoid a recession I think investors are lucky to have a lot of cheap stocks. It is a China-U.S trade war, and the global economy is in a growth slowdown, but that doesn`t automatically mean recession.

We can see a support for the S&P 500 very soon, and this is also a point were investors pay for their insurance. And that is also a point were the bear market ends. Technical analysis tells us that if this is the right thing right now, a drop to around 2,300 points would likely spark a bounce from here.

Statistically, the average bear market stops right after, or right before it officially began. It remain to see that this is happening again. A closer look at the 48-month SMA, the market failed to bounce in August 2008 which led to the biggest drop since the Great Depression. The same happened in 2001.

Is this drop a new 2001 or 2008? If not, we can see a support just like it did in 1987, 1990 and 2016. The S&P 500 has lost 20,2 percent, and the Dow is down 19,4 percent, while Nasdaq is down 23,9 percent. The Russell 2000 is down 27,3 percent, so the coming days will be interesting. Anyway; this a great moment for day traders.

Disclaimer: The views expressed in this article are those of the author and may not reflect those of Shiny bull. The author has made every effort to ensure accuracy of information provided; however, neither Shiny bull nor the author can guarantee such accuracy. This article is strictly for informational purposes only. It is not a solicitation to make any exchange in precious metal products, commodities, securities or other financial instruments. Shiny bull and the author of this article do not accept culpability for losses and/ or damages arising from the use of this publication.


Leave a comment

Filed under Stock market

Why transportation is so important


Many times the activity begin in the Rail Average before the Industrial Average. Before the economic activity began, raw materials will have to be moved from the suppliers to manufacturers. Before the automotive companies could increase production, more steel need to be transported. An increase in activity among the rail stocks would foreshadow an increase in business activity for the industrial stocks. You can also foreshadow an economic downturn.

tran 27 june

(Chart: Dow Jones Transportation Average)

The internet has changed the economy and is more different from hundred years ago, and the makeup of the DJTA has changed to favor the airlines. There is still credibility in using DJTA to confirm movements in the DJIA. Transport stocks are much more dependent on the economic environment than the average stock and will likely foreshadow economic growth.


Energy and labor cost from a large portion of expenses, The airline business is cyclical and revenues are highly susceptible to economic changes. Airline companies typically carry above average levels of debt and will be more vulnerable to changes in interest rates.


To reflect the added risks above airline stocks have traditionally sold significantly below market multiples. If the PE for the S&P 500 is 28, the average airline might sell for only 8-10 times earnings.


Airline companies bear the burden of all interest rates, energy costs and labor costs, but are still likely to act as a leading indicator of the general economic environment. Airlines biggest fear should however be that people will stop flying in airplanes.


That`s why I`m following airplane and shipping stocks all the time. It gives me a sign of a new activity in the economy or a real slowdown in the economy. As you can see on the chart above, the activity is great, which is good for the transportation stocks.


Reports today:

09:45 a.m EST Chicago PMI

10:00 a.m EST Pending Home Sales m/m


Disclaimer: The views expressed in this article are those of the author and may not reflect those of Shiny bull. The author has made every effort to ensure accuracy of information provided; however, neither Shiny bull nor the author can guarantee such accuracy. This article is strictly for informational purposes only. It is not a solicitation to make any exchange in precious metal products, commodities, securities or other financial instruments. Shiny bull and the author of this article do not accept culpability for losses and/ or damages arising from the use of this publication.


Leave a comment

Filed under Uncategorized

How to identify the trend in the market

Do you know where we are in the stock market right now? Is it cheap or is it expensive? We are near the all time high. What is the next? A stock market crash? A correction, or a consolidation? Where do we find answers to all those questions?

Indu

As an investor you need to read the map. You need to identify facts and not make any assumptions or any forecast. You can`t belive or “feel like” in the stock market. That`s why traders trade what they see, not what they think.

It is dangerous if investors and traders begin to assume. Predicting the market is a difficult, if not impossible, game. Reading the markets is an empirical science. Investors and traders with success in the markets requires serious study and analysis that is fraught with success and failures.

Failure is painful and should be looked upon as learning experiences. Technical analysis is an art form and the eye grows keener with practice. Success is the trading market is a great thing, but don`t get to smug about it. Study both successes and failures with an eye to the future.

It`s a great thing to identify the primary trend and then catch the big moves. Two thing drives the market: the fact and the psychology. The market tends to go much longer than expected (what we see right now) and much deeper as expected.

You have to understand that the markets are influenced by emotions and prone to over-react both up and down. Therefore; you have to concentrate on identification and following: identify the trend and then follow the trend and the trend is in place until proved otherwise.

This is when the trend will end, it is proved otherwise.

I will do it as easy as possible and show you a basic method of how you can identify the trend. This can be a good starting point for you to develop analysis guidelines that you are comfortable with and understand.

The first step to identify the primary trend is to identify the individual trend of the Dow Jones Industrial average (DJIA) and Dow Jones Transportation Average (DJTA), individually. Use peak and trough analysis in order to ascertain the identity of the trend.

An Uptrend is defined by prices that form a series of rising peaks and rising troughs. In the chart you will then see higher highs and higher lows.

A Downtrend is defined by prices that form a series of declining peaks and declining troughs. In the chart you will then see lower highs and lower lows.

Once the trend has been identified, it is assumed valid until proved otherwise. A downtrend is considered valid until a higher low forms, and the ensuing advance off of the higher low surpasses the previous reaction high.

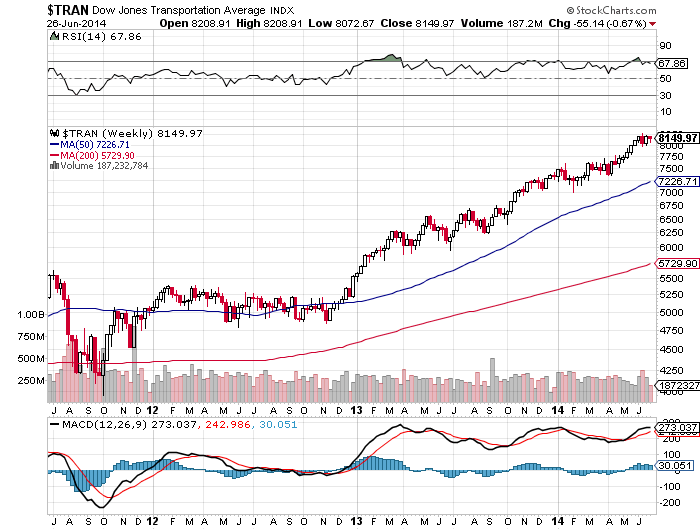
Below is a chart of the Dow Jones Transportation Average. I printed out the chart yesterday june 26, 2014. As you can see, in 2012 there was a consolidation period, and in 2013, and so far in 2014, it is all in an uptrend, but where is the top? Where is the peak?

Tran

After a peak, a series of lower lows and lower highs will be formed to make a downtrend. In the downtrend we will then see a bounce back and have a secondary rally. After a downtrend, you have to look for high volume days, like high volume washout days. High volume days signal that a possible change is looming. Alone, a high volume washout day is not a buy signal, but rather an indication to monitor price action a little closer.

If you see a higher low later on, it is too early to call it a change in the trend. The change of a trend is not confirmed until the previous reaction high is surpassed. It need to cross the trend line to call it a change in the trend.
An uptrend is considered in place until a lower low forms and the ensuing decline exceeds the previous low. You can see the uptrend in the Dow Jones Industrial average chart below. You can see a series of higher highs, and higher lows.

Bears jumping in on the top can sit on top for a long time with more all-time-highs to come, but professional traders and fund managers do this to make an insurance for their portfolio, because it is impossible to predict a new change in the trend.

Indu

All you have to do is to catch the big moves. To do this, use weekly charts to establish reaction highs and lows. But weekly charts may not portray the details you need. One possible solution is to apply a short moving average to the price plot. A 5-day moving average could be applied to smooth the price series and still allow for the details.

What I am talking about is not a science. It is just ment to offer insights and guidelines from which to begin careful study of the market movements and price action. Look at the charts, read the map and catch the big moves.

Reports today:
09:55 a.m EST Revised UoM Consumer Sentiment
09:55 a.m EST Revised UoM Inflation Expectations

Disclaimer: The views expressed in this article are those of the author and may not reflect those of Shiny bull. The author has made every effort to ensure accuracy of information provided; however, neither Shiny bull nor the author can guarantee such accuracy. This article is strictly for informational purposes only. It is not a solicitation to make any exchange in precious metal products, commodities, securities or other financial instruments. Shiny bull and the author of this article do not accept culpability for losses and/ or damages arising from the use of this publication.

Leave a comment

Filed under Stock market

Green friday

It`s optimism in the stock market again. People belive the lawmakers will solve the dept-ceiling problems. China rebound and BDI is increasing. Everything looks great. That`s in the long term. Right now the futures is down about 1 percent.

What an end of the week. Everything was green. Dow Jones was up 0,51 percent, to 15,072,60. The S&P 500 climbed 0,71 percent to 1,690,50, and Nasdaq rose up 0,89 percent to 3,807,75. 5,2 billion shares canged hands on U.S excanges, and that is 9,6 percent below the three-month average.

People belive that the lawmakers will reach a deal to end the budget impasse. That`s why we see the excanges is green now. The investors are very optimistic, and 6,4 days is the average of the days the spend to solve the problems in capitol hill.

S&P 500 is up 19 percent so far this year and from it`s 2009 low, it is up amazingly 155 percent. VIX dropped 5,3 percent today and are now down to 16,74 percent. The equity volatility gauge has fallen 7,1 percent so far this year.

China is back too, and now it seems to be a good time to invest in South East Asia. The industrial profits rose 24,2 percent in August this year. In addition; I see Baltic Dry Index has broken it`s 200 day moving average. That is good news for the economy.

Gold is still a little bit above 1300, and gold have not reacted on the shutdown earlier since 1976. The duration shutdwon has varied from one to twentyone days. Two years ago during the dept- ceiling, the gold rose from $1500 in july to $1800 in august 2011. A nice safe-heaven rally.

There`s no news to watch out for today or tomorrow. What I am looking for this week is what`s happening in capitol hill. It`s up to the republicans. People expect to see a solution and that`s why they are so optimistic. This will be an exciting week.

Markets up

Disclaimer: The views expressed in this article are those of the author and may not reflect those of Shiny bull. The author has made every effort to ensure accuracy of information provided; however, neither Shiny bull nor the author can guarantee such accuracy. This article is strictly for informational purposes only. It is not a solicitation to make any exchange in precious metal products, commodities, securities or other financial instruments. Shiny bull and the author of this article do not accept culpability for losses and/ or damages arising from the use of this publication.

Leave a comment

Filed under Stock market