
What a rally in Asia today! Japan`s Nikkei is up +2,11% to 14,338. Hang Seng is up +0,51% and ASX 200 is up +1,02%. It was a great rally in the U.S yesterday too. The Dow was up +0,97%, S&P 500 +0,81% and Nasdaq +0,85%. Great!
Why this rally now? The investors like the good news from China. The China manufacturing data is good, and that will have a positive impact on Europe. The message from the Fed minutes is also good. They say that there will be no rate increase soon.
Asian stocks rose to set for the biggest gain in three months, after minutes showed Federal Reserve policy makers see muted risk of inflation from continued U.S stimulus. Fed`s policy makers said continued stimulus to push unemployment lower doesn`t risk sparking an undesirable jump in the inflation rate.
Policy makers are watching progress toward their goal of full employment as they consider the timing of the first interest-rate increase since 2006. The Fed has said the benchmark rate will stay low for a «considerabe time». They ended its bond-purchase program that set to wind down by late this year.
The Fed have earlier said that they will keep the interest rate low at least as long as the jobless rate is below 6,5% and the outlook for inflation didn`t exceed 2,5%. Is that really possible? Let`s take a look at Japan. They have printed more money than U.S.
Japan`s inflation peaked out in the middle of the 70`s, but the real problems started in 1989. Japan`s Nikkei Index hit its all time high on December 29, 1989, during the peak of the Japanese asset price bubble. It reached an intra-day high of 38,957 before closing at 38,915,87.

(Picture: Japan`s Nikkei Index)
The bubble burst, and the Nikkei stock index plummeted and lost nearly all these gains, closing at 7,054,98 on March 10, 2009. That is 81,9% below its peak twenty years earlier. The unemployment rate increased, but stopped at 5%. Now, Japan`s unemployment is down to 3,6% (April, 2014).
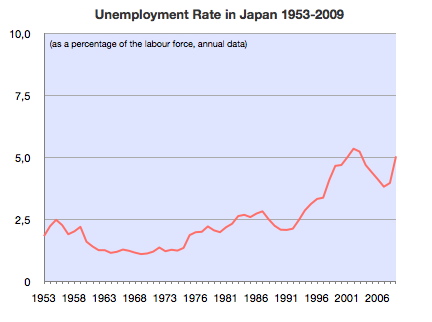
(Picture: Unemployment rate in Japan 1953 – 2009)
Japan`s inflation rate is stable, and that is strange. Normally when you print a lot of money, inflation rate are increasing and it becomes extremely difficult to reduce it. If you look at the Japan`s inflation rate, it is stable.
The inflation rate in Japan was recorded at 1,60% in March of 2014. It had an all time high of 25% in February of 1976, and a record low of -2,52% in October of 2009. Japan`s inflation rate is in black on the picture below:

(Picture: Japan and U.S inflation rate – compared)
The most important categories in the CPI (Consumer Price Index) are Food (25% of total weight). Housing (21%), Transport and communications accounts for 14%. Culture and recreation (11,5%), Fuel, light and water charges for 7%. Medical care (4,3%), clothes and footwear (4%), Furniture and household utensils, Education and Miscellaneous goods and services account for the remaining.
Central banks around the world will try to sustain an inflation rate of 2 – 3%. The purchasing power is falling if the prices of goods and services is rising. Central banks attempt to stop severe inflation, along with severe deflation. They will keep the excessive growth of prices to a minimum. Inflation plays a large role in the Fed`s decisions regarding interest rates.
So far so good!
Reports today:
08:30 a.m EST unemployment Claims
09:45 a.m EST Flash manufacturing PMI
10:00 a.m EST Existing Home Sales
Disclaimer: The views expressed in this article are those of the author and may not reflect those of Shiny bull. The author has made every effort to ensure accuracy of information provided; however, neither Shiny bull nor the author can guarantee such accuracy. This article is strictly for informational purposes only. It is not a solicitation to make any exchange in precious metal products, commodities, securities or other financial instruments. Shiny bull and the author of this article do not accept culpability for losses and/ or damages arising from the use of this publication.

