Tag Archives: Gold

Rally!

Yesterday, I was sitting in front of the TV…..eh…… in front of my computer, watching live streams with Chairman Ben Bernanke. He did not disappoint the markets. The DOW was up +1,84% and the S&P 500 was up +1,7%. What a rally!!!! Ho ho ho.

They are not going to taper now in December, but plan to start tapering in January next year. There was two good news yesterday: 1. The Fed will cut back it`s bond purchases by $10 billion, and 2. The interest rates could remain low even if unemployment drops below 6,5%. This is music in investors ears!

Gold went in the opposite direction and didn`t like the news from the Fed. Gold is now trading near the critical $1200 level. I have written about this critical level before, and this is the break even level for the mining companies.

The mining companies doesn`t earn money if the price goes below $1200. It will be very exiting to follow the gold price in the future. Watch out for this level and see if this level holds. The news yesterday was bearish for the gold, but bullish for the dollar.

A lot of investors and money makers have lost a lot of money in their gold investments since 2011 and that is because they didn`t recognize and adapt to the changing trend. We are in the same situation right now, where a lot of people don`t really know what is to come in 2014. Will we see a rally in gold?

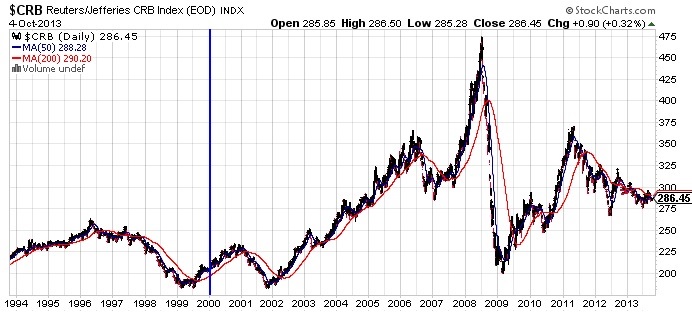
As you can see from the gold chart, we are at a stage one basing phase. 150 and 200 moving averages is slowing down and start to go sideways. This will go on for about 6-12 months. So, now you know when to expect the gold bull market start again.

In this one phase stage, a market goes both up and down and it looks like it goes nowhere. Many people are getting frustrated and start to give up and others that is not in the market stops paying attention to the market. After a bear market, a stage one basing phase will follow and make a new way for a real bull market.

We have seen many bubbles like the internet bubble, housing bubble and the market crash in 2008. Now, it seems like a new bubble is on the way. The Fed are on the way to build a dangerous federal government debt bubble.

It can be avoided by reducing the Congress spending deficit. But in the budget deal last week, they increased the government spending. All this money printing have been a disaster for the U.S.

In Mars next year, we have seen a bull market lasting for five years. What do you think will happen to QE if the economy slows again? Goldman Sachs predict the domestic GDP growth to hit 3% next year (1,7% in 2013). I hope he has right. I look forward to 2014.

News today: Unemployment Claims at 8:30am, Existing Home Sales & Philly Fed Manufacturing Index at 10:00am.

Markets up

Disclaimer: The views expressed in this article are those of the author and may not reflect those of Shiny bull. The author has made every effort to ensure accuracy of information provided; however, neither Shiny bull nor the author can guarantee such accuracy. This article is strictly for informational purposes only. It is not a solicitation to make any exchange in precious metal products, commodities, securities or other financial instruments. Shiny bull and the author of this article do not accept culpability for losses and/ or damages arising from the use of this publication.

Leave a comment

Filed under Commodities, Stock market

To taper or not to taper

The FED`s FOMC minutes, said yesterday that they could see the Fed tapering its $85 billion-a-month bond-buying program at one of the next few meetings the coming months. In addition, the committee members also saw the U.S. economy growing at a moderate pace.

This is not something new to us. They have earlier said that they want to see the unemployment rate below 6,5% and a better growth with a stabile inflation before they start to taper. Therefore, the U.S employment report in early December will be on traders and investors watch list now.

Once they came out with the news yesterday, the dollar index shot to its daily high, which is a bearish signal for the precious metals traders. Gold and silver prices dropped sharply. Where are the gold headed now?

From 1976 into the peak in 1980, gold rallied from $101,50 to $873 an ounce. A big bullish trend for the gold that time. Fear and greed are reflecting this chart, while people trade on emotions.

The gold indes peaked out and the market backed off and settled into a sideway trend from about 1982 to 1996. Then it started a sideways trend from around $281 to $514. A loooooong sideways trend for a loooong periode of time.

It went sideways in the 90`s and people considered the market to be «dead». But then the market changed in 2001 – 2002. It started a new trend that peaked out in September 2011, trading at $1900.

The chart is now very similar to the chart back in the early 80`s. If this is the future for gold, we are likely to see a sideways trend now.

But many people expect a big drop now because the market seems to be overbought. If that happend, we will se a change for the gold price. Probably a big jump. News today: PPI & Unemployment Claims at 8:30am, Philly Fed Manufacturing Index at 10:00am.

shinybull_for_sitesite-7

Disclaimer: The views expressed in this article are those of the author and may not reflect those of Shiny bull. The author has made every effort to ensure accuracy of information provided; however, neither Shiny bull nor the author can guarantee such accuracy. This article is strictly for informational purposes only. It is not a solicitation to make any exchange in precious metal products, commodities, securities or other financial instruments. Shiny bull and the author of this article do not accept culpability for losses and/ or damages arising from the use of this publication.

Leave a comment

Filed under Stock market, Stocks

The supercycle is over?

The gold is historically a hedge against the market. It`s a safe heaven. In volatile markets, we often see increasing gold prices. So, why is it so calm out there now?

Commodities use to move in a very long cycles that last many years. That`s what we call a super cycle. In the historically chart below we can see the cycle goes on between 20 and 30 years. The last cycle was a declining cycle that started in 1980 and ended in the year 2000.

As you can see from the CRB chart I have added today, the new super cycle started in 2000. The commodity prices increased in eight years, and plummeted in 2008 during the financial crises. Reuters/CRB index is an index with 28 commodities, which is commodity prices ranging from metals to oil and grains. 26 of the commodities are listed on the US and Canada exchanges.

As you can see in the chart below, we are now in the middle of the bottom in 2000 and the top in 2008. Where do we go from here? Are the commodities bullish trend over? Or is it starting a new trend? A bullish trend?
CRB

First of all; the bullish trend started in 2000 because the demand increased. At the same time the supply was at a minimum because of the downtrend we have seen since 1980. Many of the miners had to shut down their businesses. Rising demand and minimum supply means increasing commodity prices.

Most of the demand came from emerging markets. The GDP in China rose 12% a year. The supply startet to increase again which had an impact of the commodities prices. The first phase seems to be over. Do we have a phase nr two comming up soon?

If so, China will be the trigger to the next cycle by consumer spending as they spend Yuan like never before. The Chinese people are earning more money now than ten years ago. In 2004 the average income was 8500 Yuan per year. That`$1400 dollars. Today they earn about 25000 Yuan or $4200 per year.

No one is paying attention on the ernings this week. Everyone`s eyes is on Capitol Hill and the White house now. I look forward to see the earnings of Google and Apple. News to for today: Empire State Manufacturing Index at 8:30am.

Disclaimer: The views expressed in this article are those of the author and may not reflect those of Shiny bull. The author has made every effort to ensure accuracy of information provided; however, neither Shiny bull nor the author can guarantee such accuracy. This article is strictly for informational purposes only. It is not a solicitation to make any exchange in precious metal products, commodities, securities or other financial instruments. Shiny bull and the author of this article do not accept culpability for losses and/ or damages arising from the use of this publication.

Leave a comment

Filed under Commodities

Gold is a “slam dunk sell”

What a bullish week for stocks last week. S&P is above $1700 and finished the week up 12,70 points or .75%. On the other hand; commodities are struggling. Gold is below it`s important $1300 level and are now trading at $1273. Next support to look for are $1200.

I told you about Barrick Gold and the big drop in their stockprice. Some say that many miners have a production cost of $1000 and $1200 to mine an ounce of gold. That means if we see a goldprice below $1200, we will see many miners closes their businesses.

If that is the next scenario, we will see a bigger demand and less supply, which means (in theory) a level of $1000 and $1200 is a strong support. Goldman Sachs say the gold is a «slam dunk sell», and they do not say that too often. Morgan Stanley are also bearish on the gold`s outlook.

ETF`s see liquidation into the goldrallies and money managers do not see the gold as an good investment right now. Commodities are deflationg right now and so are the gold. It will probably take some time for the «insurance buyers» to come back to the market again and take it higher.

In my opinion, what`s happening in the white house on thursday this week desides the direction of the goldprices. Desember gold futures fell on friday to $1268,20 an ounce. Down -3,2% on the week. Silver also fell on friday to $21,259 an ounce. Down -2,3% on the week.

As I have talked about earlier, the P/E ratio (price-to-earnings) in the USA is now 20. A company`s standalone P/E does not give you the full picture of how expensive a stock is. Therefore you need to look at the company`s industry or the broad index to understand the price.

The total price of the index divided by its total earnings is the P/E of an index. In Europe the P/E is 10. In USA the P/E is 20. But is that expensive? Today I have added a chart for the P/E in the USA. Take a look at the P/E ratio for S&P500 during the financial crises in 2008.

PE SPX

Disclaimer: The views expressed in this article are those of the author and may not reflect those of Shiny bull. The author has made every effort to ensure accuracy of information provided; however, neither Shiny bull nor the author can guarantee such accuracy. This article is strictly for informational purposes only. It is not a solicitation to make any exchange in precious metal products, commodities, securities or other financial instruments. Shiny bull and the author of this article do not accept culpability for losses and/ or damages arising from the use of this publication.

Leave a comment

Filed under Commodities

Earning seasons

Earning seasons are upon us, and as you know; stock prices follow earnings. So, whats driving the markets is corporate profits, but that`s also the key to a dropdown. To make the S&P 500 go up 1 percent, you need to have a profit of $1 billion.

That is not what happend during the dot-com bubble. That`s why the markets plummeted. Now, it is a match of the index/stock prices and the profits (after tax). Normally, it goes up and down within a trendline. When we hit the roof, we will often see a correction. Looking at the correlation between the index and the profits right now, it isn`t something wrong with the bull market.

October means earnings begins to roll out and gives the traders a huge trading opportunities. Concur technologies Inc (CNQR) took the Wall Street by storm with the earnings and revenues last time. The volume skyrocket, and so did the stockprice.

We are at the all time high and it will be interesting to see the earnings comming in now. I think the picture will be mixed, but if the shutdown continue in the long run, it may affect the GDP and the earnings, which means you know how Q4 will be?

I often look at the commodity prices and I follow copper very closely. Copper are trading up and I often see the copper price together with the 10 day moving average. The price is on target of the 10 MA and tells me a lot about the demand for this commodity. The gold price is also on target for  the 10 MA.

News to have a look at today is Crude Oil Inventories at 10:30am, 10 Year Note Auction 1:01pm, FOMC Meeting Minutes at 2:00pm. I look forward to hear from the FOMC meeting. I have added two charts today. Copper and Gold compared to the 10 day MA.

Copper 10MA

Gold 10 MA

Disclaimer: The views expressed in this article are those of the author and may not reflect those of Shiny bull. The author has made every effort to ensure accuracy of information provided; however, neither Shiny bull nor the author can guarantee such accuracy. This article is strictly for informational purposes only. It is not a solicitation to make any exchange in precious metal products, commodities, securities or other financial instruments. Shiny bull and the author of this article do not accept culpability for losses and/ or damages arising from the use of this publication.

Leave a comment

Filed under Commodities, Stock market