The supercycle is over?

The gold is historically a hedge against the market. It`s a safe heaven. In volatile markets, we often see increasing gold prices. So, why is it so calm out there now?

Commodities use to move in a very long cycles that last many years. That`s what we call a super cycle. In the historically chart below we can see the cycle goes on between 20 and 30 years. The last cycle was a declining cycle that started in 1980 and ended in the year 2000.

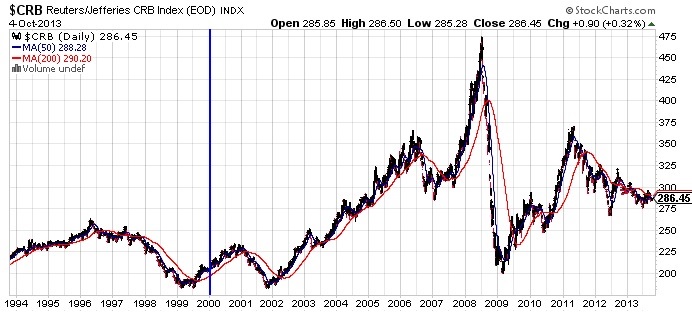
As you can see from the CRB chart I have added today, the new super cycle started in 2000. The commodity prices increased in eight years, and plummeted in 2008 during the financial crises. Reuters/CRB index is an index with 28 commodities, which is commodity prices ranging from metals to oil and grains. 26 of the commodities are listed on the US and Canada exchanges.

As you can see in the chart below, we are now in the middle of the bottom in 2000 and the top in 2008. Where do we go from here? Are the commodities bullish trend over? Or is it starting a new trend? A bullish trend?
CRB

First of all; the bullish trend started in 2000 because the demand increased. At the same time the supply was at a minimum because of the downtrend we have seen since 1980. Many of the miners had to shut down their businesses. Rising demand and minimum supply means increasing commodity prices.

Most of the demand came from emerging markets. The GDP in China rose 12% a year. The supply startet to increase again which had an impact of the commodities prices. The first phase seems to be over. Do we have a phase nr two comming up soon?

If so, China will be the trigger to the next cycle by consumer spending as they spend Yuan like never before. The Chinese people are earning more money now than ten years ago. In 2004 the average income was 8500 Yuan per year. That`$1400 dollars. Today they earn about 25000 Yuan or $4200 per year.

No one is paying attention on the ernings this week. Everyone`s eyes is on Capitol Hill and the White house now. I look forward to see the earnings of Google and Apple. News to for today: Empire State Manufacturing Index at 8:30am.

Disclaimer: The views expressed in this article are those of the author and may not reflect those of Shiny bull. The author has made every effort to ensure accuracy of information provided; however, neither Shiny bull nor the author can guarantee such accuracy. This article is strictly for informational purposes only. It is not a solicitation to make any exchange in precious metal products, commodities, securities or other financial instruments. Shiny bull and the author of this article do not accept culpability for losses and/ or damages arising from the use of this publication.

Leave a comment

Filed under Commodities

Gold is a “slam dunk sell”

What a bullish week for stocks last week. S&P is above $1700 and finished the week up 12,70 points or .75%. On the other hand; commodities are struggling. Gold is below it`s important $1300 level and are now trading at $1273. Next support to look for are $1200.

I told you about Barrick Gold and the big drop in their stockprice. Some say that many miners have a production cost of $1000 and $1200 to mine an ounce of gold. That means if we see a goldprice below $1200, we will see many miners closes their businesses.

If that is the next scenario, we will see a bigger demand and less supply, which means (in theory) a level of $1000 and $1200 is a strong support. Goldman Sachs say the gold is a «slam dunk sell», and they do not say that too often. Morgan Stanley are also bearish on the gold`s outlook.

ETF`s see liquidation into the goldrallies and money managers do not see the gold as an good investment right now. Commodities are deflationg right now and so are the gold. It will probably take some time for the «insurance buyers» to come back to the market again and take it higher.

In my opinion, what`s happening in the white house on thursday this week desides the direction of the goldprices. Desember gold futures fell on friday to $1268,20 an ounce. Down -3,2% on the week. Silver also fell on friday to $21,259 an ounce. Down -2,3% on the week.

As I have talked about earlier, the P/E ratio (price-to-earnings) in the USA is now 20. A company`s standalone P/E does not give you the full picture of how expensive a stock is. Therefore you need to look at the company`s industry or the broad index to understand the price.

The total price of the index divided by its total earnings is the P/E of an index. In Europe the P/E is 10. In USA the P/E is 20. But is that expensive? Today I have added a chart for the P/E in the USA. Take a look at the P/E ratio for S&P500 during the financial crises in 2008.

PE SPX

Disclaimer: The views expressed in this article are those of the author and may not reflect those of Shiny bull. The author has made every effort to ensure accuracy of information provided; however, neither Shiny bull nor the author can guarantee such accuracy. This article is strictly for informational purposes only. It is not a solicitation to make any exchange in precious metal products, commodities, securities or other financial instruments. Shiny bull and the author of this article do not accept culpability for losses and/ or damages arising from the use of this publication.

Leave a comment

Filed under Commodities

Bullish move

S&P 500 and the Dow was up 2,18% yesterday. Nasdaq was up 2,26%. What a bullish move! The biggest move since the beginning of this year. The biggest move comes from the Russel 2000, which is up 2,50%. VIX dropped down -15,92%, and ended up to open at 16,48.

All this because of the positive news we talked about yesterday. Obama have invited the republicans and the democrats to discuss the debt limit and both parts seems to be positive about a short term solution.

When we see a bullish move like that, we often see gold goes in the opposite direction. Gold broke its important $1300 level, and are now trading at $1283,7. It seems like the gold will continue it`s downtrend.

The gold prices are in trouble. It`s probably a gold price crices. We have had a downtrend for a while, and it seems to continue. The comming hyperinflation is imminent, and the FED`s balance sheet problems goes in the opposite direction of the goldprices. That is nasty for the precious metal.

At the same time we can see a rebound in the U.S dollar, and that is often a very bearish factor for the gold index. Jobless claims showed a rise in claims yesterday. The data was skewed because the reports did not include all 50 U.S states.

Micron Technology (MU) have been overbought since early september. What a bullish stock that is! Micron Technology Inc is one of the biggest and best providers of advanced semiconductor solutions. They manufactures and markets DRAM, NAND Flash and NOR-flash memory and other innovative memory technologies. Micron falls after Q4 earnings miss.

News for today: Preliminary UofM Consumer Sentiment at 9:55am.

Today I have added a chart with DJ, Nasdaq and S&P 500 compared with the gold bugs. This showes us that it has been a terrible year so far for the gold stocks. Gold traded at $1700 at the beginning of this year. Barrick gold Corp Inc traded at 47 in january and are now at 17,84. Wow!

HUI and index

Disclaimer: The views expressed in this article are those of the author and may not reflect those of Shiny bull. The author has made every effort to ensure accuracy of information provided; however, neither Shiny bull nor the author can guarantee such accuracy. This article is strictly for informational purposes only. It is not a solicitation to make any exchange in precious metal products, commodities, securities or other financial instruments. Shiny bull and the author of this article do not accept culpability for losses and/ or damages arising from the use of this publication.

Leave a comment

Filed under Commodities, Stock market

Explosive growth

The Russell-2000 is the best measure of small caps and has the last two months outperformed the S&P 500 by 2-1. The last 10 months has been amazing for Russell 2000 which is up 37%. That is 12% better than S&P 500 which is up (only) 25%.

Small cap stocks have outperformed large cap stocks in seven of the past ten years by 40 percent. The earnings for the small-cap stocks rose by 9% (Russell 2000). S&P rose only 5% over the last twelve months.

When bond yield are rising, the history tells us that the small-cap stocks are outperforming. We saw Microsoft buying Nokia for $7 billion, but those two are blue chips stocks. Microsoft is not explosive enough. Small-cap stocks are, and they are in a great position for takeovers.

When the rumors for takeovers are in the market, the small-cap stocks prices are going wild. Now, it is a good time for many small-cap stocks to sell. It seems to be a good invironment now. Money is cheap now, but everyone know that the interest rate are rising, which means it will be more expensive to buy a company next year.

Many companies have been cautious with their money during the recesssion. They now have a stockpile of $2 trillion! That`s enough money pay some of the federal deficit in a few seconds. They can use the money to buybacks, dividende or M&A.

The thing is that companies want to grow, and that is fast. In addition; investors want to see the stockprice go up to heaven. But, it`s difficult to grow organically. That`s why Google bought Youtube. That`s why Facebook bought Instagram. They have both been growing, and the investors doesn`t cry over this kind of strategy.

Don`t forget the private equity firms that have hoarding cash now. They have about $1 billion in cash. They must spend $200 million the next months because that`s the rules. If they don`t do that, they must pay the money back to the investors. As you know; they will buy small-cap stocks.

I am looking for companies with strong financials. I am looking for companies that have a huge growth potential and I am looking for companies that is innovative, because that is attractive to the people looking for a takeover.

S&P 500 and the Dow rose yesterday as Republicans and Democrats in Congress showed early signs of a possible break in the impasse. The shutdown is in it`s ninth day, and President Obama invited lawmakers from both parties to the white house to discuss the government shutdown and raising the debt limit.

The VIX rose to 19,60 yesterday. A level above 20 is normally associated with investors anxiety and concern about the near-term direction of the market. Today I will look for these news: Unemployment Claims at 8:30am, 30 Year Bond Auction 1;01pm.

The volume was light on NYSE yesterday. 5,9 billion shares was changing hands. I will sit on my hands now until october 17. Just wait and see what`s happening. Russell 2000 was down 0,36% yesterday. Every time Russell 2000 breaks the 50 MA it rebounds. Will that happen again? Remember that we are at the all time high too. Take a look at the chart below:

RUT

Disclaimer: The views expressed in this article are those of the author and may not reflect those of Shiny bull. The author has made every effort to ensure accuracy of information provided; however, neither Shiny bull nor the author can guarantee such accuracy. This article is strictly for informational purposes only. It is not a solicitation to make any exchange in precious metal products, commodities, securities or other financial instruments. Shiny bull and the author of this article do not accept culpability for losses and/ or damages arising from the use of this publication.

Leave a comment

Filed under Stocks

Earning seasons

Earning seasons are upon us, and as you know; stock prices follow earnings. So, whats driving the markets is corporate profits, but that`s also the key to a dropdown. To make the S&P 500 go up 1 percent, you need to have a profit of $1 billion.

That is not what happend during the dot-com bubble. That`s why the markets plummeted. Now, it is a match of the index/stock prices and the profits (after tax). Normally, it goes up and down within a trendline. When we hit the roof, we will often see a correction. Looking at the correlation between the index and the profits right now, it isn`t something wrong with the bull market.

October means earnings begins to roll out and gives the traders a huge trading opportunities. Concur technologies Inc (CNQR) took the Wall Street by storm with the earnings and revenues last time. The volume skyrocket, and so did the stockprice.

We are at the all time high and it will be interesting to see the earnings comming in now. I think the picture will be mixed, but if the shutdown continue in the long run, it may affect the GDP and the earnings, which means you know how Q4 will be?

I often look at the commodity prices and I follow copper very closely. Copper are trading up and I often see the copper price together with the 10 day moving average. The price is on target of the 10 MA and tells me a lot about the demand for this commodity. The gold price is also on target for  the 10 MA.

News to have a look at today is Crude Oil Inventories at 10:30am, 10 Year Note Auction 1:01pm, FOMC Meeting Minutes at 2:00pm. I look forward to hear from the FOMC meeting. I have added two charts today. Copper and Gold compared to the 10 day MA.

Copper 10MA

Gold 10 MA

Disclaimer: The views expressed in this article are those of the author and may not reflect those of Shiny bull. The author has made every effort to ensure accuracy of information provided; however, neither Shiny bull nor the author can guarantee such accuracy. This article is strictly for informational purposes only. It is not a solicitation to make any exchange in precious metal products, commodities, securities or other financial instruments. Shiny bull and the author of this article do not accept culpability for losses and/ or damages arising from the use of this publication.

Leave a comment

Filed under Commodities, Stock market